Statistics
Historical graphs of server health and a report of traffic dropped by the firewall.
Overview
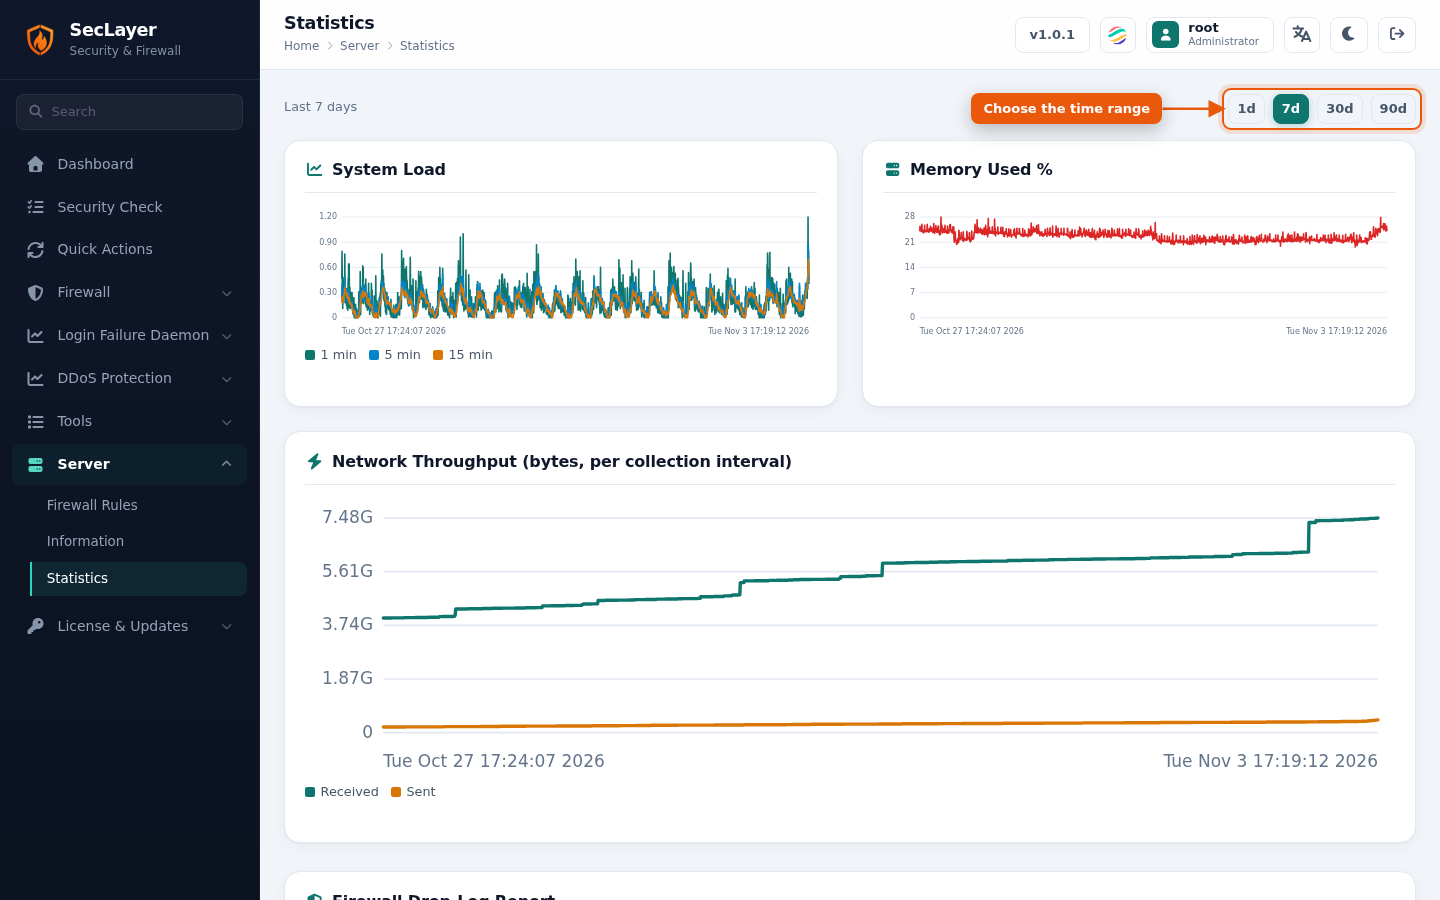
Open Server > Statistics and choose a range: 1d, 7d, 30d or 90d. These graphs are shown:
- System Load (1, 5 and 15 minute averages)
- Memory Used %
- Network Throughput (received and sent)
- Disk Write Throughput
- Apache requests per second and busy/idle workers
- MySQL queries per second and connections
Firewall Drop-Log Report
Lists recently dropped packets with these columns: time, source and destination, ports, protocol, interface, country and host. Use it to see who the firewall is blocking.
Requirements
- Statistics collection must be enabled with
ST_ENABLE. The page shows a warning when it is off. - The drop-log report also needs
DROP_LOGGINGandST_IPTABLESenabled in Firewall Configuration.